|HOMEへ|
PC解説|
gnuplot|
Gnuplotでグラフ作成
データファイル(sample-box.dat)は次のようになっているとします.
#X    Y     Z    W
1    15    20    5
2    20    22   10
3     3    11    4
4     5     6    2
5    26     2   12
6     8    12   15
7    12    15   20
8    15    20   12
9     9     1   11
10    5    23   10
- データファイルの1列目を横軸(X), 2列目を縦軸(Y)として, グラフを描きます.
- 棒グラフ作成用のファイルの要点は次のとおりです.
set boxwidth 1.0
plot 'sample-box.dat' using 1:2 with boxes
- using 1:2 を指定していますので,
これらを使ってグラフを描いてみると...
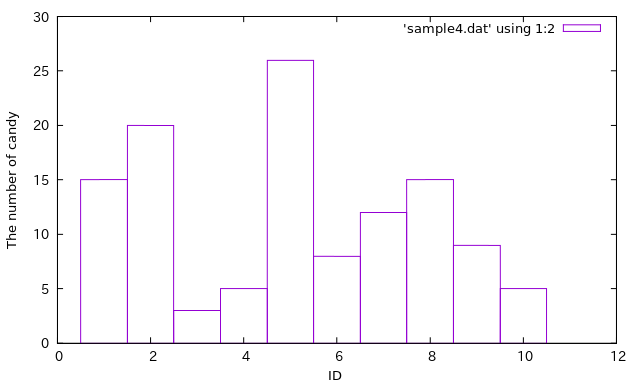
できました.
- set boxwidth 1.0 棒グラフの幅を1.0とする(図によって幅の調整が必要).
- using 1:2
- X用には1列目のデータを使い,
- Y用には2列目のデータを使う.
- with boxesで棒グラフを指定.
(補足)データは縦軸のデータのみでもOKです.
つまり「using 2」などとy軸に対応する
カラムのみ指定するか, 「using 1:2」や「using :2」でOKです.
gnuplot ver 5では, 棒に色塗りが可能となっています.
次にその機能の紹介を兼ねて, 別の種類の棒グラフを描かせてみます.
(スクリプトファイルの主要部分)
set style fill solid 0.2
set boxwidth 1 relative # 棒グラフ の 棒幅
plot 'sample-box.dat'  using 1:($2+$3) with boxes title "data-3" fill pattern 1,\
	 '' using 1:2 with boxes title "data-2" fill pattern 2
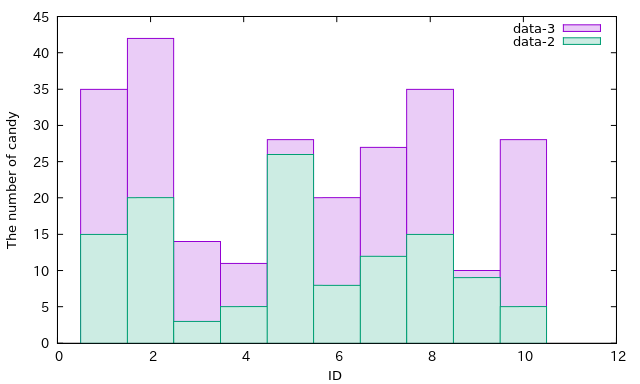
- 「set style fill solid (0〜1) 」で塗りの濃さを指定 (plot中で個別指定も可能)
- 「set boxwidth (0〜1) relative」で棒の幅を相対値で指定
- 図の背面にくる$2+$3(2列目+3列目のデータ値)を最初にプロットし,
その次に図の前面にくる$2(2列目のデータ値)をプロット
- 塗りの種類を「fill pattern」で指定
- 塗りの濃さを「fill solid」で指定可能
- 色を変える場合には, 「linecolor」で指定可能
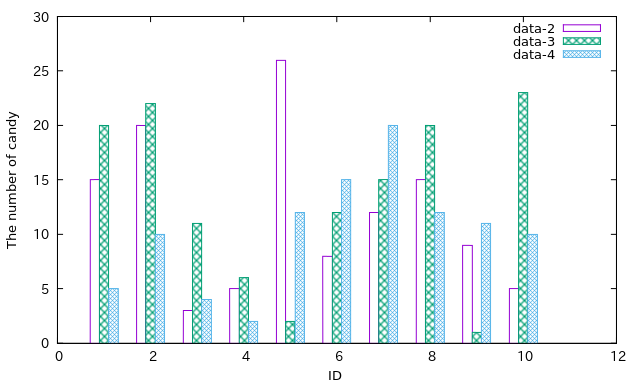
(変更後のスクリプトの主要部分)
set style fill pattern 0
set boxwidth 0.2

plot 'sample-box.dat' using ($1-.2):2 with boxes title "data-2",\
	           '' using 1:3 with boxes title "data-3",\
                   '' using ($1+.2):4 with boxes title "data-4"
- 「set style fill pattern (整数)」棒を塗りつぶしに設定
(fill solid (0.9〜1.0) でも可)
- 棒の幅を0.2に設定(要調整).
- Y1のデータ列を「1,2,3,4,5」から左横に0.2だけずらす(要調整).
- Y2のデータ列を「1,2,3,4,5」の真上にする.
- Y3のデータ列を「1,2,3,4,5」から右横に0.2だけずらす(要調整).
|BACK(gnuplot)|
MENU(ページトップ)|
NEXT(plotコマンド)|
Last modified: Thu Mar 15 10:06:39 2018
Ken-ichi Yamamoto
e-mail: yamamoto@eee.u-ryukyu.ac.jp